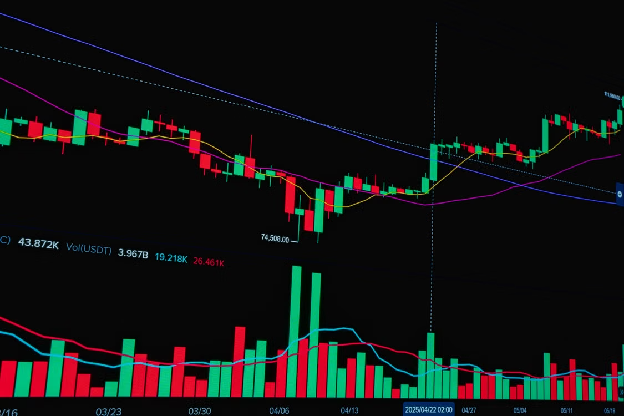


Robinhood closed at $122.11 on September 4, just below its $122.21 pivot, after tagging $124.7. The daily trend is still bullish, but the price action is showing signs of fatigue near resistance. The next move could be decisive.
Daily structure remains strong but stretched
The daily chart still looks bullish. The EMA stack is fully aligned, with the 20-period at $105.95 above the 50-period at $100.85, and the 50-period above the 200-period at $96.45. RSI14 sits at 65.94, which is strong but not extreme. MACD is also positive, with the line at 4.92 above the signal at 2.77.
The problem is the Bollinger Bands. Price closed above the upper band at $121.26. That kind of extension usually raises the odds of a pause or a mean-reversion move. A pullback toward the $103.3 midline is possible, but it would not necessarily break the larger uptrend. ATR14 at 7.38 confirms this is a volatile stock, so swings can be sharp.
Hourly chart shows a warning sign
The hourly setup is still aligned bullishly. EMA20 sits at $118.79, EMA50 at $112.99, and EMA200 at $104.72. RSI14 is at 67.32, which is hot. But the MACD tells a slightly different story. The line at 4.17 has slipped below the signal at 4.26, producing a small negative histogram of -0.09. That is not a major breakdown. It is more of a subtle momentum divergence.
Price is sitting near the hourly pivot at $122.34, with resistance at $122.84 and support at $121.57. The tight range suggests the market is digesting recent gains, not pushing higher with confidence.
Shorter timeframes point to consolidation
The 15-minute chart looks neutral. RSI14 is at 45.44, which is neither overbought nor oversold. MACD shows a short-term bearish tilt, with the histogram at -0.26. Price is hovering near the lower Bollinger Band at $122.04. This timeframe is more useful for execution than for calling the broader trend.
For the bullish case to reassert itself, HOOD needs to hold above daily support at $119.72 and reclaim $124.6 with conviction. A positive hourly MACD histogram would help confirm that intraday momentum is coming back. On the downside, a break below $119.72 would be the first real technical crack. A deeper pullback toward the $105.95 EMA20 or $103.3 Bollinger midline is possible if buyers fail to defend current levels.
News flow adds uncertainty
Sentiment around Robinhood is mixed. Cathie Wood reportedly bought shares despite controversy over tokenized stock offerings. Coverage of Robinhood’s blockchain efforts has also been active, including a rally in a related altcoin. That could keep speculative interest alive. At the same time, headlines questioning whether Webull is a better buy and criticism of tokenized offerings could accelerate a pullback if support breaks.
Overall, the daily structure still favors buyers. But the stretched Bollinger Band and the hourly momentum divergence suggest patience is warranted. With volatility high and news flow evolving, this is not the time for aggressive conviction in either direction.